
A dump just landed on your transaction, or a field shows an amount nobody can explain. How do you see what the program is actually doing, without being a developer? That is exactly what the ABAP debugger is for, and it works remarkably well as a reading tool.
This tutorial is written for functional consultants: four ways to open the debugger, the screen explained zone by zone, navigating with F5 to F8, then the breakpoints and watchpoints that answer the real question: why does this field hold that value?
- The ABAP debugger is mostly used for reading: analyzing a dump, understanding a field value, following an existing program.
- 4 ways in:
SE80(Execute, Debugging),SM37with thejdbgcommand, a breakpoint in the editor, or/hin any transaction. - Keyboard navigation: F5 steps into the detail, F6 executes the block, F7 steps back out, F8 runs to the next stop.
- A breakpoint stops the program at a given place; a watchpoint stops it when a variable changes value.
- In production: observe, never modify a variable in debug. Reproduce on the test system as soon as you can.
What the ABAP debugger is for when you are not a developer
The debugger has a reputation as a developer tool. True for writing code, false for reading it. In real project life, three situations make it indispensable for a functional profile: a dump to analyze, an inexplicable field value to trace, and an existing program that nobody can quite describe anymore.
The modern two-process debugger has been the long-standing standard in SAP GUI, and it is the one we use here. Developers also work in Eclipse with the ABAP Development Tools, but for a functional consultant the GUI debugger remains the everyday tool: it opens from any transaction, with nothing to install.
The SAP dump, your first entry point
Let’s start with the screen every consultant has met: the runtime error, better known as a dump.
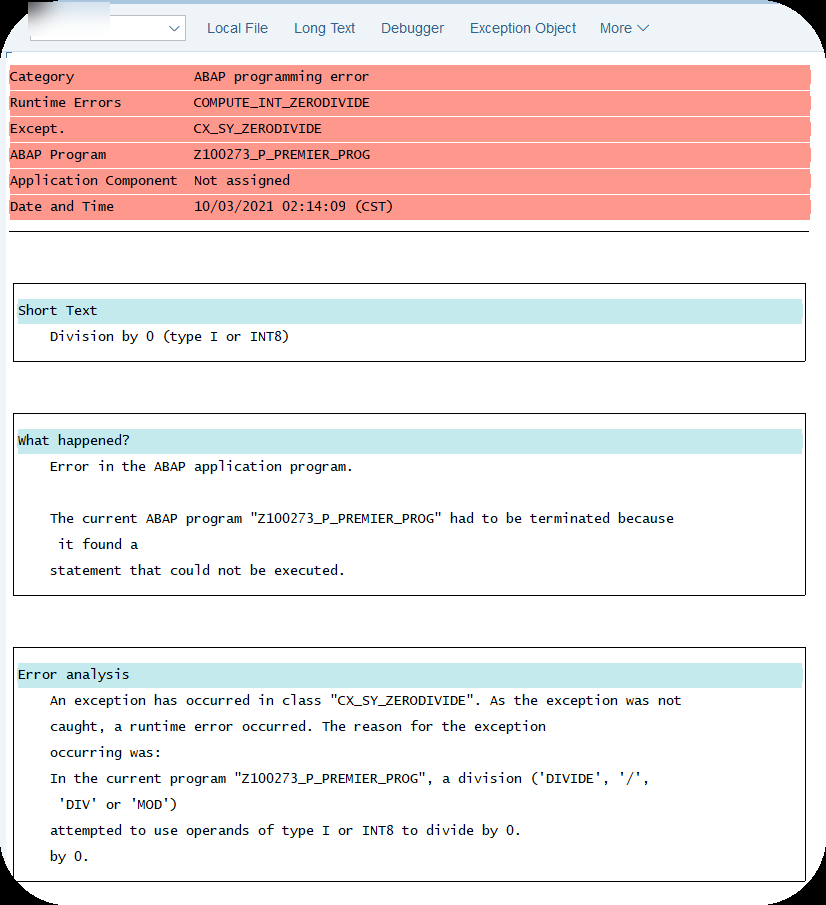
The dump already says a lot: the error category, the name of the runtime error (here a division by zero), the exception raised and the program involved. The Error analysis section even tells the story. But the dump tells you what happened, not why the variable was zero at that moment. That is where the debugger takes over.
4 ways to open the ABAP debugger
| Access | The move | When to use it |
|---|---|---|
/h in a transaction | Type /h in the command field, press Enter, then trigger the action | The everyday case: debug the SAP transaction you are working in |
| Breakpoint in the editor | Click in the column left of the code: a STOP sign appears | You already know where to look in the program |
SE80 | Right-click the program, Execute, then Debugging | Start a program directly in debug mode |
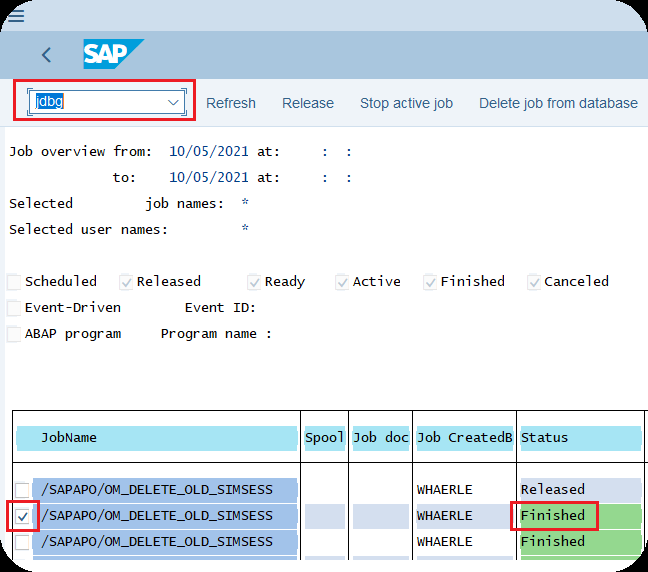
SM37 + jdbg | Select a finished job, type jdbg in the command field | Replay a background job to see what it did |
The most universal one is /h: from any transaction, type it in the command field and press Enter.
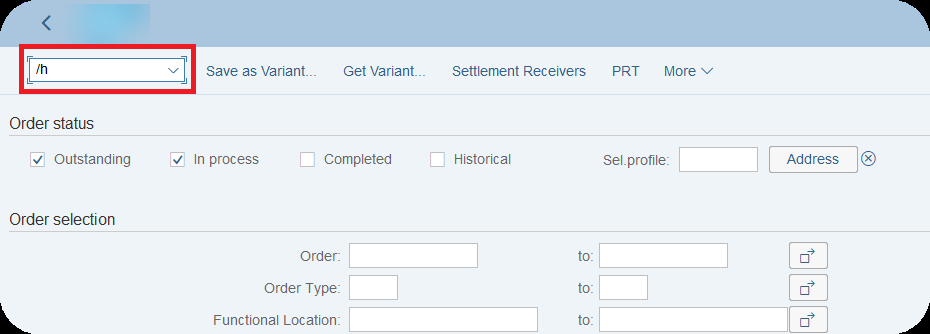
SAP confirms with a discreet message, and the debugger will open at your next action on the screen.

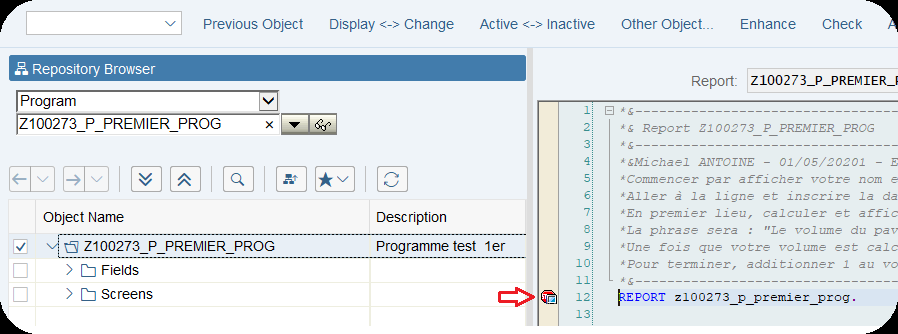
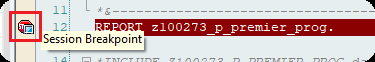
Second frequent access: a breakpoint set directly in the program editor. One click in the beige column left of the code, a STOP sign appears, and the debugger will open at the next execution that runs through that line.
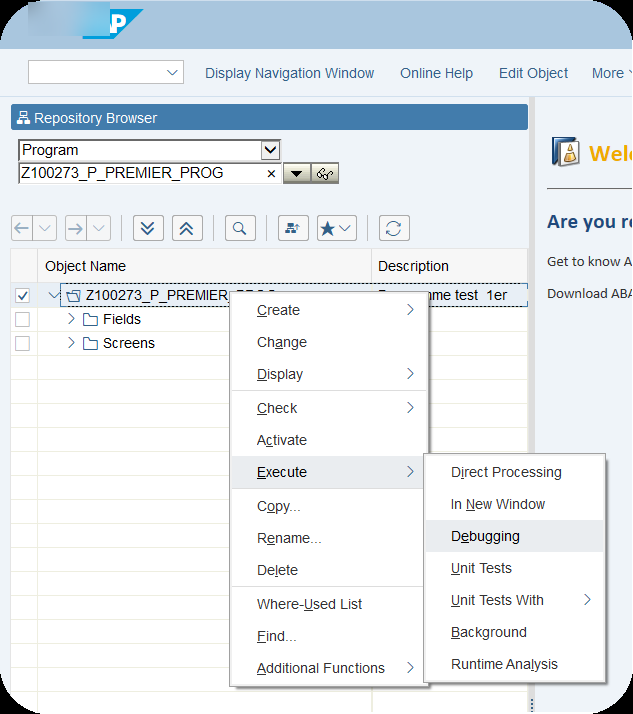
To start an entire program in debug, go through SE80: right-click the program, Execute, then Debugging.
Finally, for background jobs: in SM37, select a finished job and type jdbg in the command field. SAP simulates rerunning the job in debug mode, which is invaluable to understand what a nightly run actually did. Jobs themselves deserve a dedicated guide: see our introduction to SAP jobs.
Reading the debugger screen: 4 zones and 3 desktops
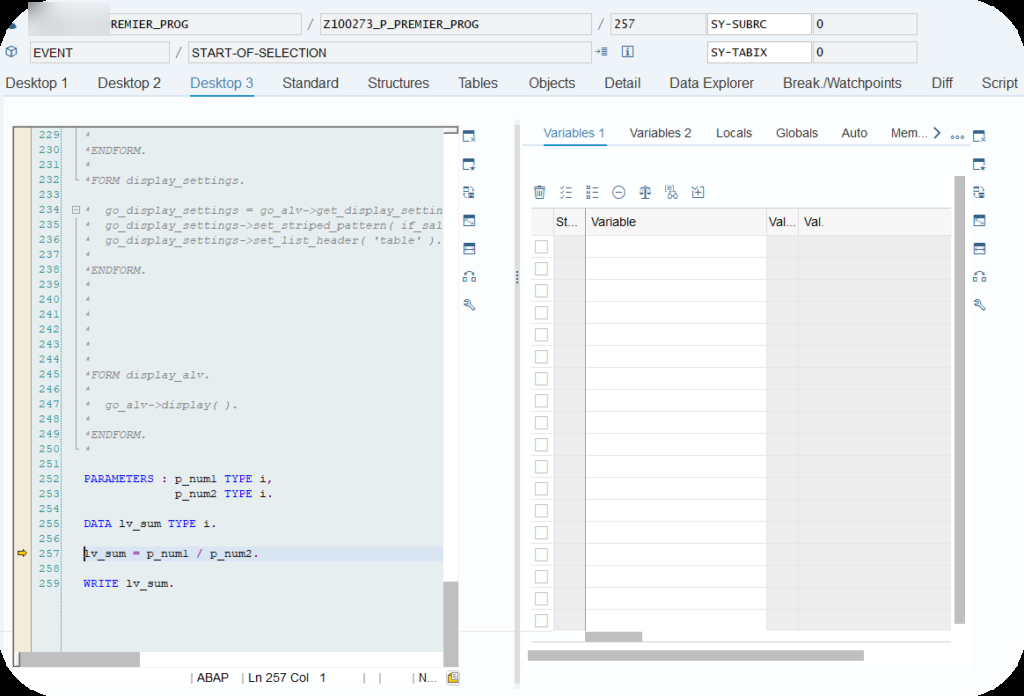
The debugger opens on a dense screen. Four zones are enough to find your way around.
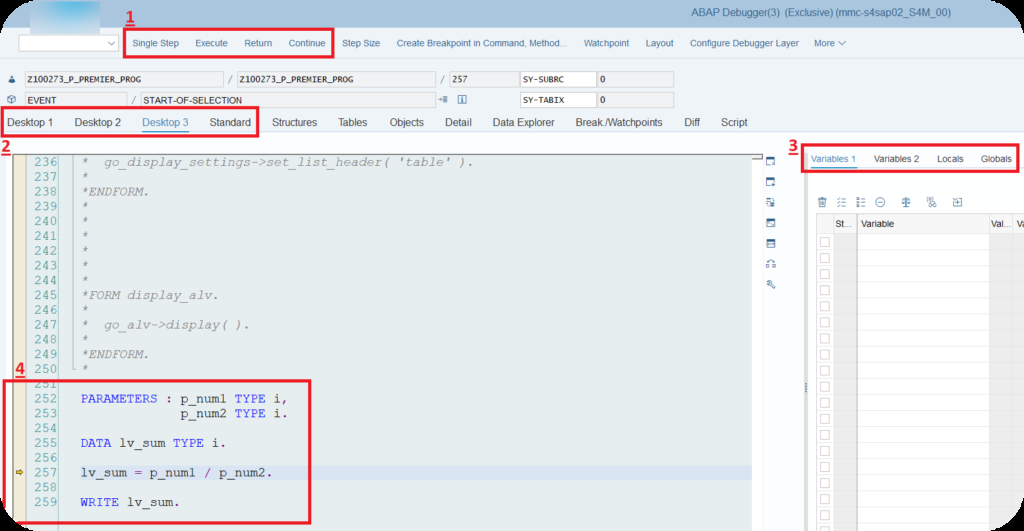
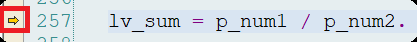
At the top, the execution buttons (Single Step, Execute, Return, Continue) drive the progress. Just below, the Desktop 1 to 3 and Standard tabs offer different layouts of the same information. On the right, the variable area. In the middle, the source code, with a yellow arrow marking the current position: the line it points to has not been executed yet.
The desktops are worth a try: same content, different layouts. Pick the one that matches the way you work and it will stay your default screen.
Navigating the code: F5 to F8 and Goto Statement
Four keys carry the whole navigation, and the logic of each fits in one sentence.
- Single Step (F5): executes the next operation, then stops. If it is a routine call, you step into it.
- Execute (F6): executes the next operation but jumps over blocks. A whole routine runs in one go, without entering it.
- Return (F7): finishes the current block and goes back up to the calling code.
- Continue (F8): runs to the next breakpoint or watchpoint. If there are none left, the program finishes and the debugger closes.
In reading practice: F6 to move fast at the main program level, F5 when you want to see inside a specific block, F7 when you stepped into one by mistake, F8 to jump from one point of interest to the next.
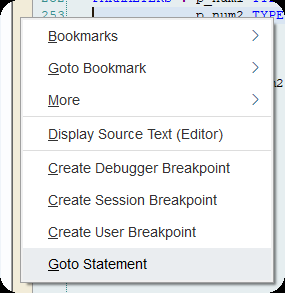
To reposition your reading without stepping through everything, the right-click menu offers Goto Statement: the execution cursor moves to the chosen operation.
Following a variable: locals and globals
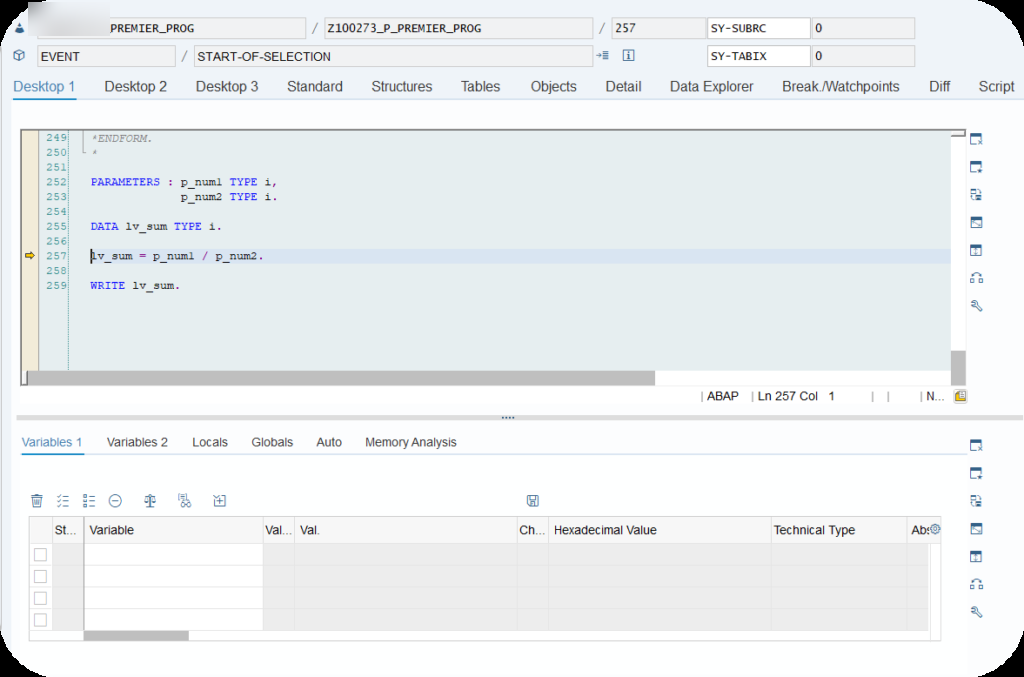
Here we are at the heart of the functional consultant’s use case: why does this field hold this value. In the debugger, double-click any variable in the code to add it to the variable area, where its value refreshes in real time at every execution step.
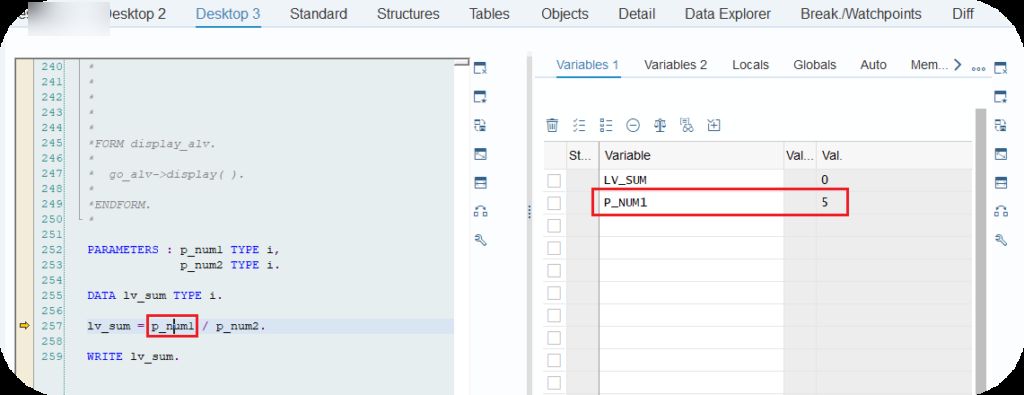
SAP distinguishes two families. Local variables only live inside their block: when a program calls a routine, the routine’s variables exist only while it runs, and the Locals tab lists them. Global variables are reachable everywhere in the program, and the Globals tab gathers them all.
Breakpoints: stopping the program at the right place
A breakpoint is a stopping point: whatever path the program takes, execution halts at that spot and the debugger hands you back control. The simplest way to set one: a left click in the column left of the target line, directly during debugging.
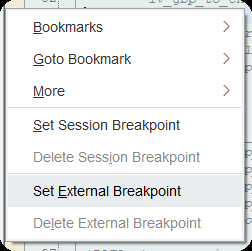
Right-clicking the same spot offers the different types: the session breakpoint lives as long as your logon session, the external breakpoint arms itself for calls coming from outside (web, RFC), and the debugger breakpoint only survives the current debug session. On top of those, a developer can write a static breakpoint into the code itself.
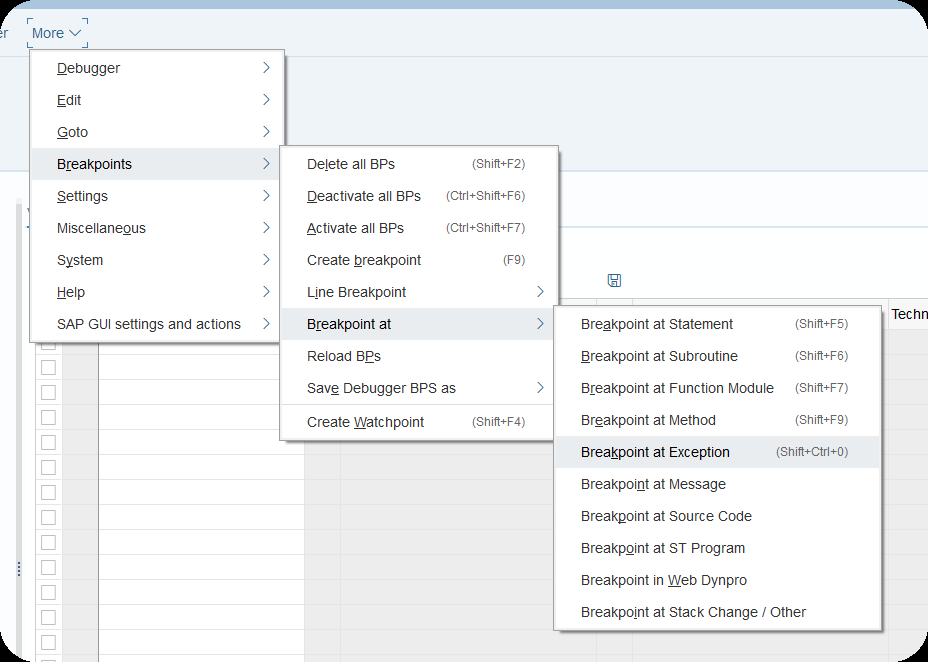
More powerful still, the Breakpoint at menu sets stops by category: at every occurrence of a given statement, at a method call, or when an exception is raised. That last one is the killer move for replaying a dump: breakpoint at exception, F8, and the debugger stops exactly where the exception is born, as detailed in the official reference on breakpoints and watchpoints.
Watchpoint: monitoring the value of a field
The watchpoint flips the logic: instead of stopping the program at a place, it stops it when a variable changes value. It is the direct answer to the question that opens this article.
-
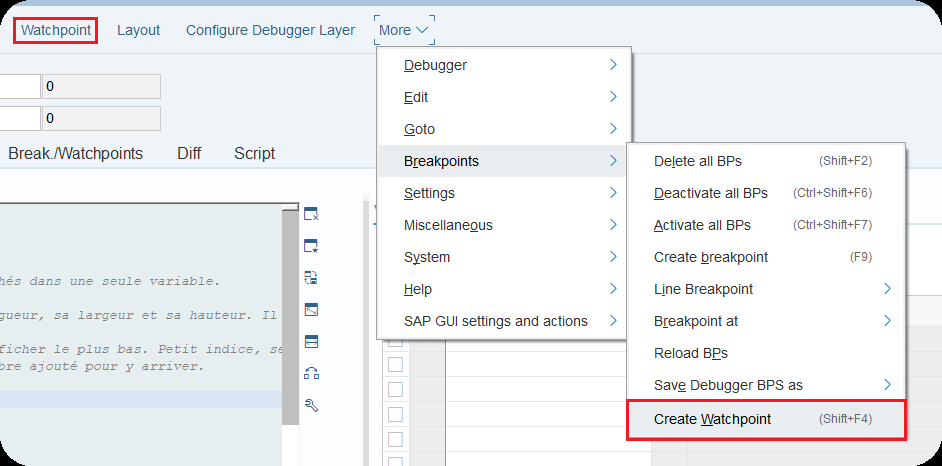
1Open the watchpoint creation
In the debugger, use the Watchpoint button in the toolbar, or right-click the variable in the code.
-
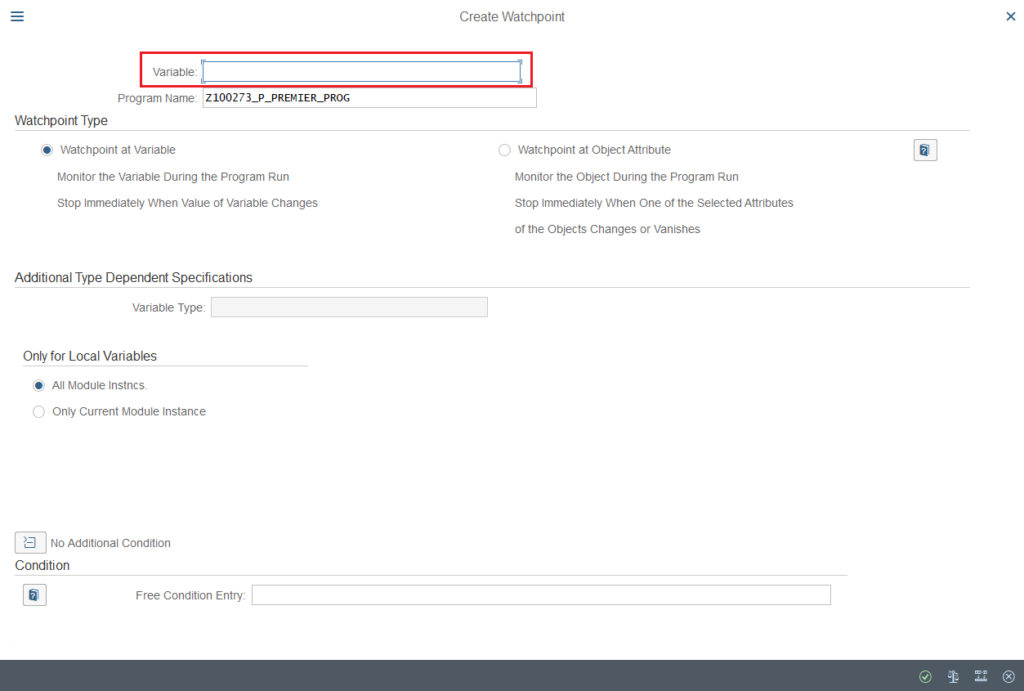
2Pick the variable
The Create Watchpoint dialog asks for the variable to watch, on the variable itself or on an object attribute.
-
3Refine if needed
A free condition narrows the stop: for example, only halt when the value goes above a given threshold.
-
4Let it run with F8
Continue (F8) runs the program: every time the variable changes, the debugger stops and shows the responsible line.
Watchpoint set on the field with the mysterious amount, F8, and the program stops exactly on the statement that fills it. Within minutes you know which routine, which condition and which data produced the value: exactly what you need to open a precise ticket or challenge a specification, and the same technique helps to analyze an SHDB recording that replays badly.
Technically, the debugger lets you change the value of a variable while the program runs. Never do it on a productive system: you would distort a real business process with unpredictable consequences. On PRD you observe; then you reproduce the scenario on the test system to experiment. And some authorization profiles block it anyway.
The ABAP debugger is not a developer tool that functional people borrow on the sly: it is the system’s reading tool, and it belongs to everyone who needs to understand what SAP actually does. Learn the four ways in, tame F5 to F8, and save the watchpoint for the big mysteries. To keep going with everyday tools, our guide to SAP jobs is the natural companion to this one, and the public course Using ABAP Debugger extends the topic on the official side.
FAQ: your questions about the ABAP debugger
How do I start the SAP debugger with /h?
Type /h in the command field of any transaction and press Enter: SAP displays “Debugging switched on”. The debugger will open at your next action on the screen (Enter, clicking a button, confirming a field).
What is the difference between a breakpoint and a watchpoint in SAP?
A breakpoint stops the program at a precise spot in the code, whatever its state. A watchpoint stops it when a watched variable changes value, wherever that happens. The first answers “what happens here?”, the second “who changes this value?”.
How do I debug a finished background job in SM37?
In SM37, select the finished job with its checkbox, type jdbg in the command field and press Enter. SAP simulates rerunning the job in debug mode, so you can analyze step by step what the processing actually did.
What do F5, F6, F7 and F8 do in the ABAP debugger?
F5 (Single Step) executes the next operation and steps into blocks; F6 (Execute) executes while jumping over blocks; F7 (Return) finishes the current block and goes back to the caller; F8 (Continue) runs to the next breakpoint or watchpoint, or to the end of the program.
What is the difference between local and global variables in the debugger?
Local variables exist only inside their block (a routine, a function module) and are visible only while it runs, in the Locals tab. Global variables are reachable everywhere in the program and are listed in the Globals tab.
Can I use the SAP debugger in production safely?
For reading, yes, with the right authorizations. The absolute rule: never change the value of a variable in debug on a productive system. To experiment, reproduce the scenario on the quality system.
Keep reading
SAP Background Jobs: SM36, SM37 and the Job Lifecycle Explained
The sales report has to be ready every morning before the teams arrive. Transfer orders need to be processed every five minutes, weekends included. Nobody runs these programs by hand:...
SAP Learning Hub: review, price, and is it worth paying to practise?
As soon as you start looking to train seriously on SAP, one name keeps coming up: SAP Learning Hub. And with it, the same quietly asked question: is it really...
SAP ECC vs S/4HANA: the key differences for your SAP career
If you look into SAP for your career, two acronyms keep coming up: ECC and S/4HANA. One is the older generation of SAP's ERP, the other is the current version....
Split Valuation in SAP MM: Configure It Step by Step
Split valuation in SAP MM lets a single SAP material carry several distinct stock values, managed by valuation type. In plain terms: one material number in the master record, but...