
SAP pMRP is neither one more MRP run nor a quick facelift of LTP. Predictive Material and Resource Planning is a simulation: nothing you do in it touches your operational data until you click Release.
That boundary changes everything for the production planner: you can finally test a demand plan, watch work center overloads show up months ahead, and try several answers without any risk. Here is how the tool actually works in S/4HANA, screen by screen.
- pMRP is a capacity simulation that runs upstream of operational MRP, on a simplified demand plan fed by PIRs.
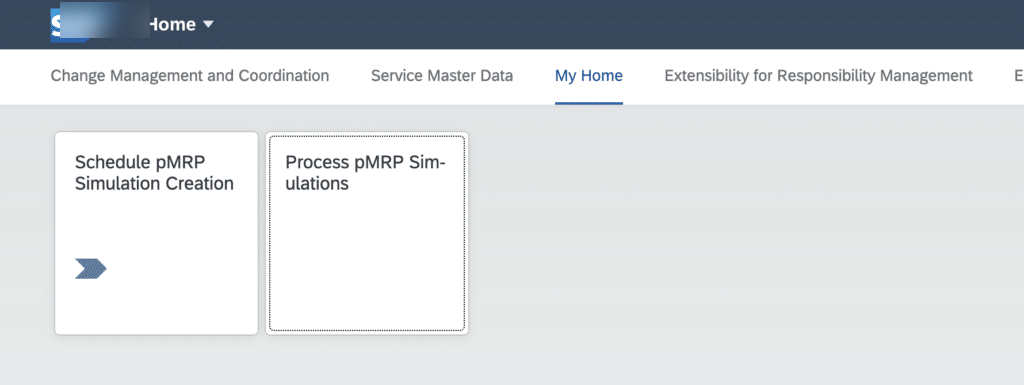
- Two Fiori apps carry the process: Schedule pMRP Simulation Creation (creation) and Process pMRP Simulations (processing).
- The creation job now offers 3 templates: Top-Level Materials, Work Centers, and Components (the most recent one).
- The planner has 5 levers: change the source of supply, adjust capacity, reduce demand, accept the system proposal, or buy instead of produce.
- Release pushes the simulation to operational MRP or to an inactive version; before that, nothing is written to the live plan.
SAP pMRP in a nutshell: simulate capacity before running MRP
Introduced with S/4HANA 1909 on the PP side, pMRP answers a question every production planner has asked at some point: will my demand plan fit on my work centers, and if not, what can I do about it now, while there is still time?
To answer it, predictive MRP runs a deliberately simplified MRP algorithm on a demand plan derived from your PIRs (Planned Independent Requirements). The result is not an executable schedule: it is an early snapshot of the load, reliable enough to spot capacity problems months in advance, and light enough to iterate through several scenarios in a single day.
The full process fits in seven steps:
-
1Check the master data
Material master, BOM, work centers, routings, production versions and PIRs must be active and clean: the simulation inherits their quality.
-
2Create the simulation
An application job generates the reference data according to the template you pick (materials, work centers or components).
-
3Read the demand plan
The simulated demand plan is displayed period by period, with capacity problems flagged in red.
-
4Inspect the work center load
The graphical view compares load against available capacity per period, taking multilevel manufacturing lead times into account.
-
5Adjust
The planner pulls the available levers: source of supply, capacity, demand, system proposals.
-
6Compare scenarios
A simulation can be copied: you compare two answers to the same problem before making the call.
-
7Release
The chosen scenario is transferred to operational planning, or stored in an inactive version.
pMRP vs LTP vs operational MRP: who does what
The confusion is common, and understandable: three tools handle forward-looking requirements. Their roles differ sharply, though.
| Tool | Nature | When to use it |
|---|---|---|
| Operational MRP (MRP Live) | Execution: calculates actual requirements and generates planning elements | Day-to-day planning work, on live data |
| LTP (Long Term Planning) | Historical simulative planning from the ECC era, complete but heavy, in SAP GUI | Already in place, proven need for detailed simulation |
| pMRP | Simplified capacity simulation, Fiori based, introduced with S/4HANA 1909 | Detect and solve capacity problems early, compare scenarios quickly |
pMRP is often presented as the successor of LTP, and the positioning holds as long as you qualify it: LTP remains available and mature, pMRP remains younger and deliberately simpler. Both coexist in S/4HANA, and the choice depends on your need: a complete multi-domain simulation still leans toward LTP, a fast demand-to-capacity loop clearly leans toward pMRP.
Prerequisites: the data pMRP needs
Good news on the configuration side: pMRP requires no specific customizing beyond what classic MRP already demands. If your MRP runs, pMRP can run.
The trade-off sits on the data side. The simulation consumes the active planning master data: material master with its MRP views, BOMs, work centers, routings and production versions, plus the PIRs that make up the demand plan. A pMRP simulation is only worth what this data is worth: poorly structured MRP areas or outdated routings will produce a load snapshot that is as wrong as it is reassuring.
The production mode matters as well: the data the simulation consumes depends directly on how your production types are set up, since the production versions are what tie material, BOM and routing together.
The two Fiori apps behind pMRP
The whole pMRP process lives in the Fiori launchpad, through two complementary applications: Schedule pMRP Simulation Creation to create the simulations, and Process pMRP Simulations to work with them.
The first application creates a background job that prepares the simulation’s reference data. The second opens the planner’s workspace: simulation list, demand plan, capacity views and adjustment levers. One set of reference data can feed several simulations, which lets you compare scenarios under identical conditions.
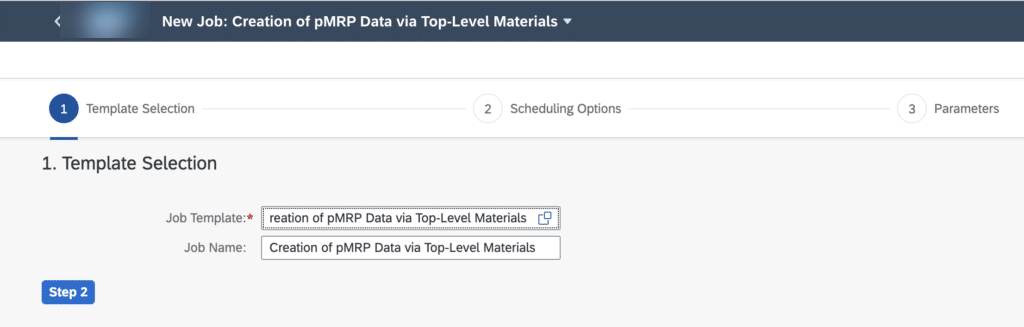
Creating a simulation: the job walkthrough and the 3 templates
Creation goes through a three-step wizard: template choice, scheduling options, selection parameters.
First choice, the job template. It determines the angle of attack of the simulation, and this is where the tool has grown since its early days: three templates are now on offer.
- Creation of pMRP Data via Top-Level Materials: selection starts from the material master; the system reads the PIRs of the selected materials and derives the capacity allocated to the work centers.
- Creation of pMRP Data via Work Centers: selection starts from the work center; the system reads the capacity reservations of the selected work centers and traces back to the materials and their PIRs.
- Creation of pMRP Data via Components: the most recent one; selection starts from the components, with filtering on MRP parameters.
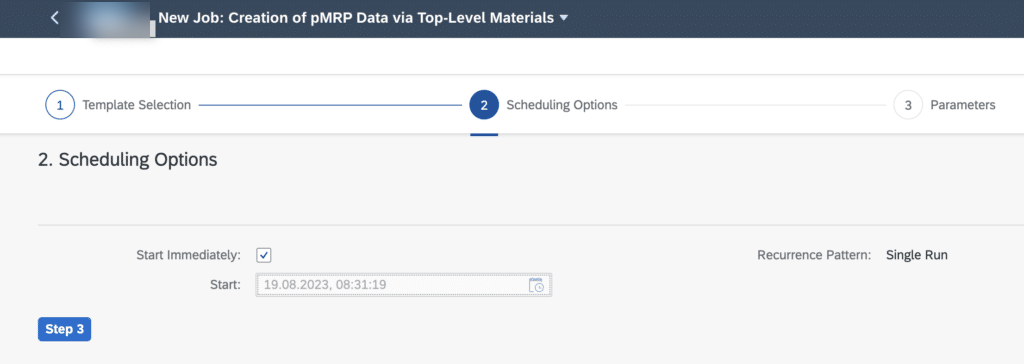
Second step, scheduling: run the job immediately or schedule it for a later date, as with any application job.
Third step, the selection parameters: which materials, work centers or components are in scope, plant, simulation horizon, period granularity. These parameters vary with the template chosen in step 1.
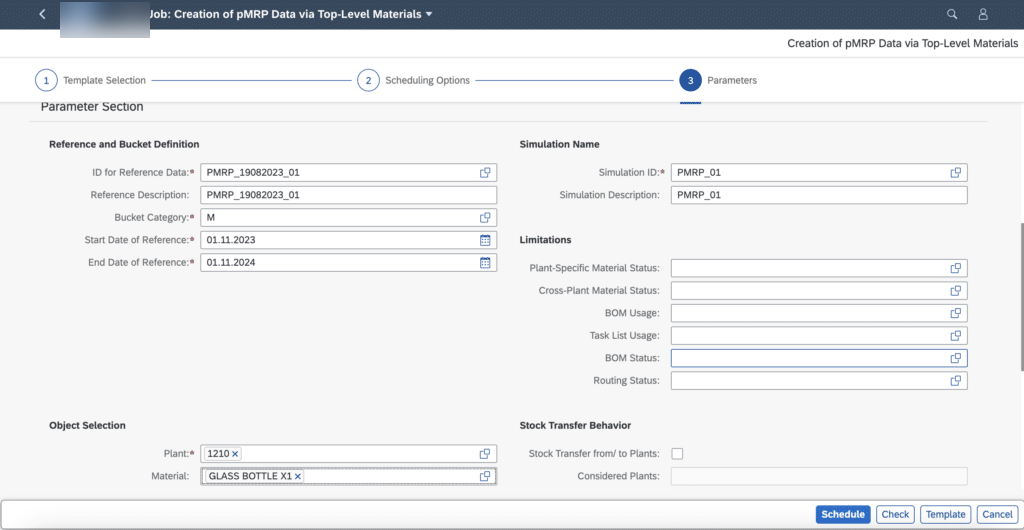
Once the job has run, make a habit of checking the Application Log: job status and any error messages live there. A green job with warnings deserves five minutes of attention before you analyze anything.
Processing the simulation: demand plan, capacity view and KPIs
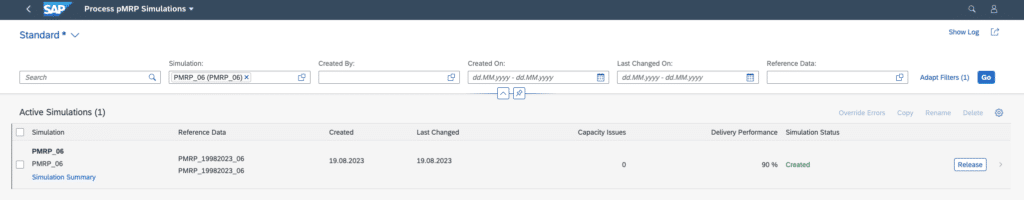
On to the second application, Process pMRP Simulations. Its home screen lists the available simulations with their indicators: number of detected capacity problems, Delivery Performance, status.
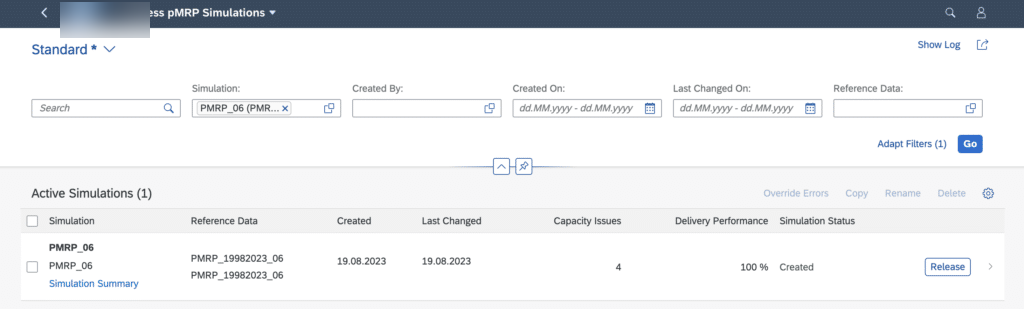
Opening a simulation takes you to the Demand Plan Simulation: the demand plan period by period, where red cells flag a capacity problem. The Inspector Panel, on the right, details each selected issue.
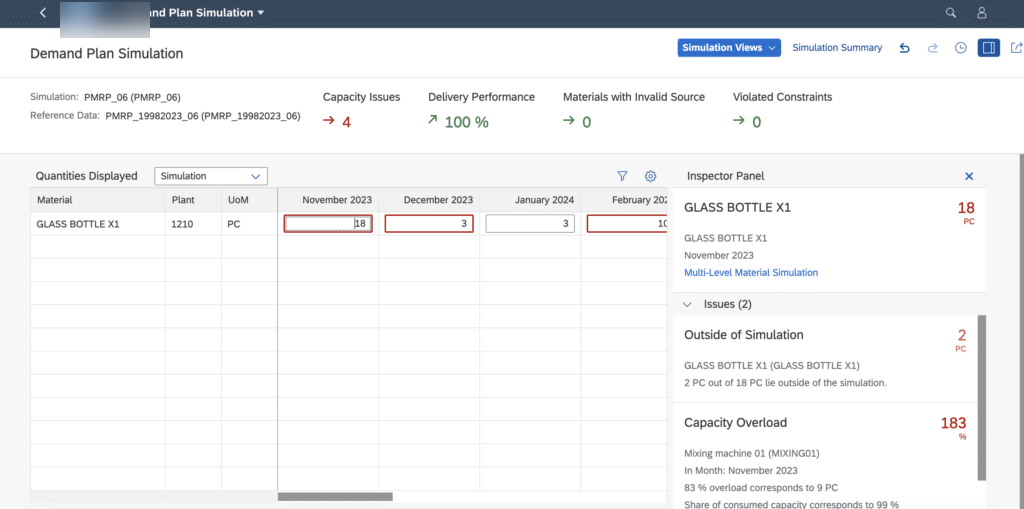
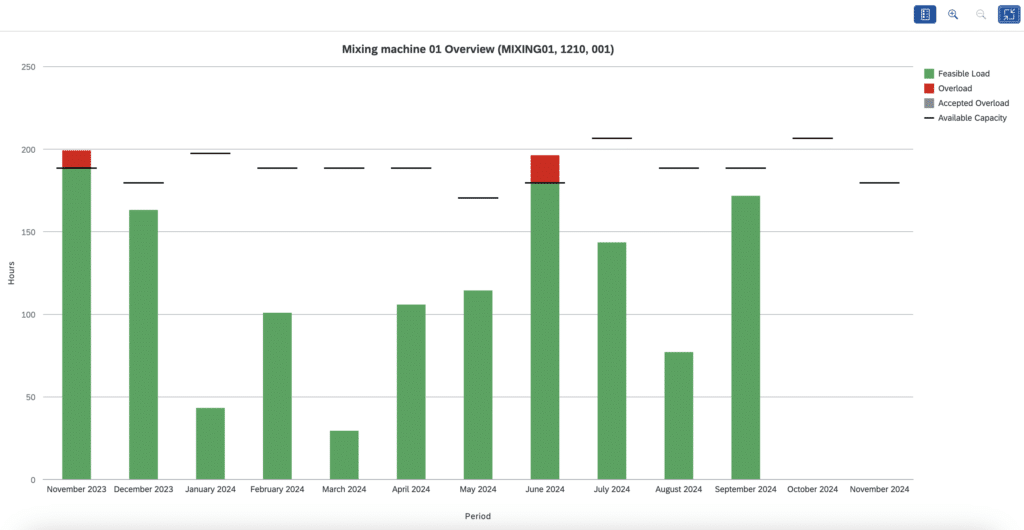
The capacity view completes the picture: a histogram per period, a horizontal line for the available capacity. As long as the load stays under the line, the plan is feasible and shows in green; whatever exceeds it shows in red. The view accounts for the in-house production time of materials across a multilevel chain, which avoids the false positives of a naive load reading.
The planner’s decisions: where pMRP really pays off
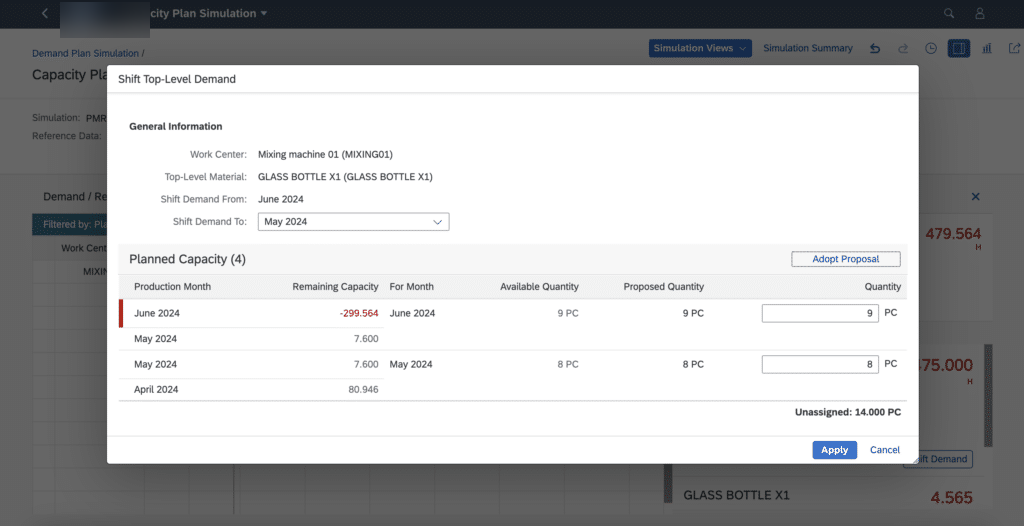
Detecting an overload is not enough: the value of pMRP lies in proposing quantified answers and measuring their effect immediately. Five levers are available to the planner: change the source of supply, adjust the work center’s capacity utilization, reduce demand, accept the system proposal (pre-produce or shift production), or buy instead of produce when no internal option holds.
First lever in action, demand adjustment. On a given overload, pMRP itself proposes the quantity that would bring the plan back within capacity; the Adopt Proposal button aligns the plan with the proposal.
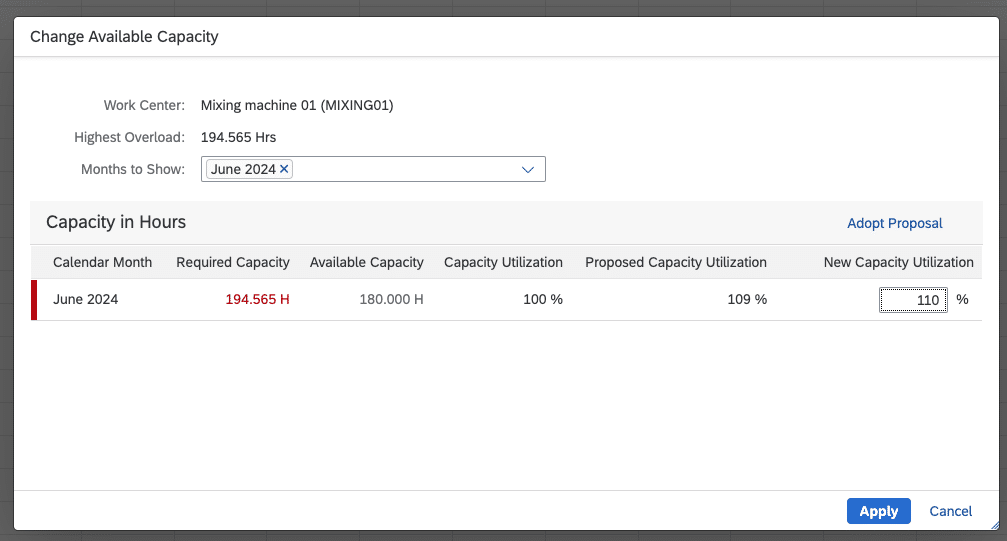
Second lever, capacity itself. The Change Available Capacity dialog allows utilization beyond the nominal capacity; here too the system proposes the right value (Proposed Capacity Utilization) and the planner can adopt it or enter their own.
Every adjustment feeds back into the simulation’s two indicators. The primary goal: bring Capacity Issues down to zero. The price to watch: Delivery Performance, which measures how much of the initial plan is actually served. Reducing demand solves the capacity problem but degrades delivery performance; arbitrating between the two is precisely the planner’s job.
One last reflex before deciding: copy the simulation and test an alternative answer on the same reference data. Comparing an increased capacity scenario against a trimmed demand scenario takes a few minutes and spares you plenty of debate in the S&OP meeting.
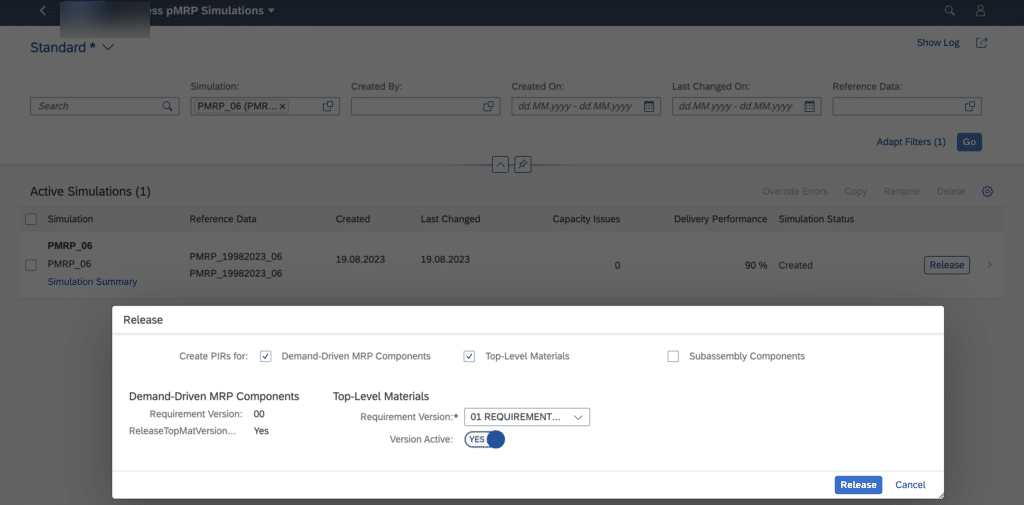
Release: pushing the simulation to operational planning
Once the scenario is chosen, the Release button transfers the simulation results. Two targets are possible: the operative MRP version, whose PIRs are then updated with the adjusted quantities, or an inactive version, which keeps the scenario without touching the live plan.
This is the only moment in the process where pMRP writes outside its sandbox. Until that button is pressed, your operational data stays intact: you can let a whole team try the tool with zero risk for the running plan.
pMRP will replace neither your S&OP nor your MRP: it fills the blind spot between the two, that moment when the demand plan exists but nobody has checked yet that it fits on the work centers. For a PP planner, it offers one of the best effort-to-value ratios in the recent S/4HANA scope. The logical next step on the data side: check that your MRP areas are structured properly, because every simulation inherits their structure.
FAQ: your questions about SAP pMRP
Does pMRP replace LTP (Long Term Planning)?
Not strictly. pMRP is the Fiori oriented functional successor for fast capacity simulation, but LTP remains available and mature in S/4HANA. A complete, detailed simulation still leans toward LTP; a fast demand-to-capacity loop leans toward pMRP.
What S/4HANA version do you need for pMRP?
pMRP has been available since S/4HANA 1909. Later releases have extended the tool, notably with the third data creation template based on components (Creation of pMRP Data via Components).
Does pMRP require specific customizing?
No. pMRP relies on the configuration of classic MRP: if your MRP runs, pMRP can run. It does require active, clean master data though: material master, BOM, work centers, routings, production versions and PIRs.
Does pMRP change my operational planning data?
No, all the work happens in simulation. Operational data is only touched at Release time, and even then: the release can target an inactive version, which keeps the scenario without modifying the live plan.
Can you compare several scenarios in pMRP?
Yes. One set of reference data can feed several simulations: you copy the simulation, apply a different answer to the same capacity problem, and compare the Capacity Issues and Delivery Performance indicators of the two scenarios.
What is the difference between pMRP and MRP Live?
MRP Live is the operational run: it calculates actual requirements and generates the planning elements. pMRP is a capacity simulation that runs upstream, on a simplified plan, to catch problems before they reach the live plan.
Keep reading
SAP PRT: Production Resources and Tools
On an industrial site, the tools shared between production lines are often invisible in SAP. Jigs, probes and technical drawings move from one order to the next, but nobody knows...
Beginner's guide to batch management in SAP MM
I have seen consultants tick the "Batch management" box on thousands of materials in a MASS run, without realizing the batch level was still set at client level. A few...
SAP batch determination and management
You are configuring SAP batch determination and the engine does not kick in. You are picking batches in the wrong order even though the sort rule is correctly set up....
SAP Production Version: setup with C223 and MRP4
https://youtu.be/Bae4g30aZC4 The production version is the SAP object that says "to manufacture this material, you combine this bill of materials with this routing, over this period". On an S/4HANA project,...